Rolling
30 day hits likely to rise 29% in July!
How
have the hits grown?
The V8 website aims to be interesting, lively and topical for V8 enthusiasts and the V8BB aims to attract good quality postings with informative and accurate comments and advice. How are we doing? |
Update
on Wednesday 25th July 2006 Yesterday the hit count (excluding the repeat hits from the same visitors) was 370 taking the rolling 30 day hits total to 9,272. The projected figure for the end of July 2007 is now 9,550 hits up 29.6% on the end of June figure of 7,370. The total hits (including repeat hits from the same visitors in any day) is likely to be around 34,770 at the end of July. |
||||||||||||||||||
|
Major
step change in V8 website hits seen in first half of July
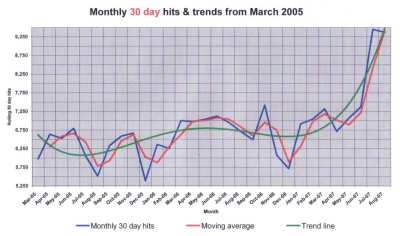 Where are the hits going in July and August? 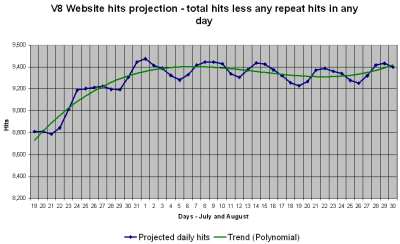 The rolling 30 day hit count moved through the 9,000 level on 23rd July 2007. The rolling 30 day figure removes any repeat hits from the same visitors in any day - this is known as the "unique" hit count. Using the multiple of total hits to unique hits of around 3.75 seen at the end of June, that suggests total hits for July could be 35,425. The peak hours for hits have around 6.5% of daily hits so that implies an average peak hit rate of around 77 hits an hour. |
Projection
of end of month V8 website 30 day hits for July and August 2007
The projected end of month rolling 30 day hit count (blue) has continued to rise for a third month, but at a much faster rate. The projected end of July 30 day hits figure is 9,447 up 28% in a single month from 7,370 at the end of June 2007. That is a major step change in hits on the V8 website. The polynomial trend line (green) has also turned up substantially. Using a projection model, the end of August 2007 rolling 30 day hits figure is projected to be 9,372 in the daily chart above. For August the hit trend curve is likely to flatten. You can also see in the daily chart alongside the regular weekly cycle in daily hits. A factor the above projection does not include is the usual seasonal fall during August and the first half of September when many V8 enthusiasts are away on holiday. So it will be interesting to see if the hits fall back. In the first chart above you can see the dip in hits in August/September 2005 and 2006. There is a larger dip around Christmas and the New Year. Posted: 23.7.07 |