| Reported
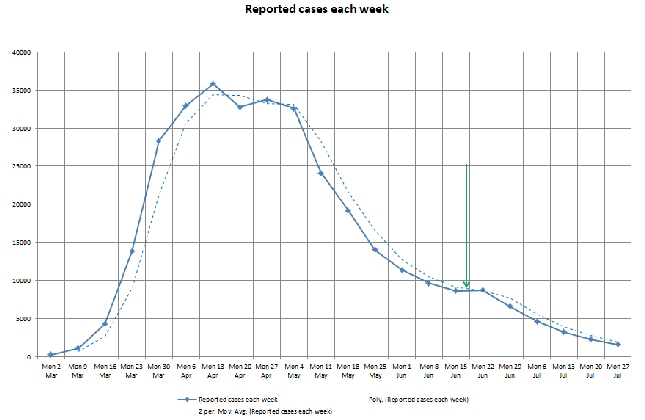
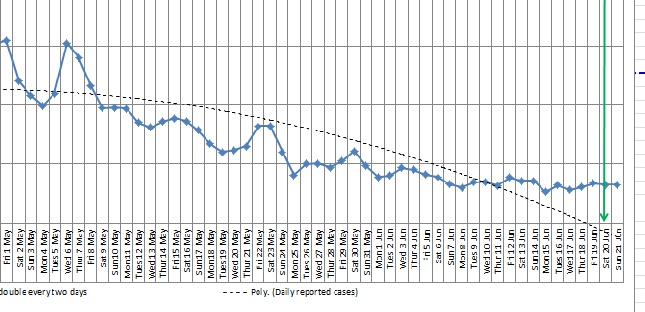
daily Covid-19 cases running near level The V8 Webmaster has been following the daily reported Covid-19 cases on a spreadsheet and whilst the rate has fallen from the peak, currently it's level and not falling as before. Looking at the two charts alongside: Top chart - reported cases each week You can see the level area. The subsequent fall is only because I have included a hopeful increased rate of fall in cases to create a projection. Lower chart - daily reported cases This chart shows how the reduction in daily cases has flatlined over the last two weeks. For both social and economic reasons we desperately need to release layers of the lock-down constraints but clearly care will be needed in how people behave in observing careful distancing and protection methods. Posted: 200620 |
| ||